THIS POST IS A DISCUSSION DRAFT as of Oct 1, 2026. PLEASE DON'T QUOTE UNTIL IT'S FINISHED. BUT COMMENTS AND SUGGESTED EDITS ARE VERY WELCOME.
Important note: This post is not about the current state of this Nature Preserve nor is about the management in recent years. It's about the state of the preserve as seen by studies dated 1996 and 2015. It focuses on the question of whether we have systems of monitoring and analysis of ecosystem quality (or health or integrity) that are adequate to assure the long term health of the preserves.
In 1985 Tomlinson was permanently protected as a one-acre Illinois Nature Preserve. Originally called Tomlinson Cemetery Prairie, this remnant, according to the Nature Preserve website, “is one of only two savannas protected as nature preserves in the Grand Prairie Section of the Grand Prairie Natural Division.” High-quality savannas are even rarer than prairies. This is a very precious site.
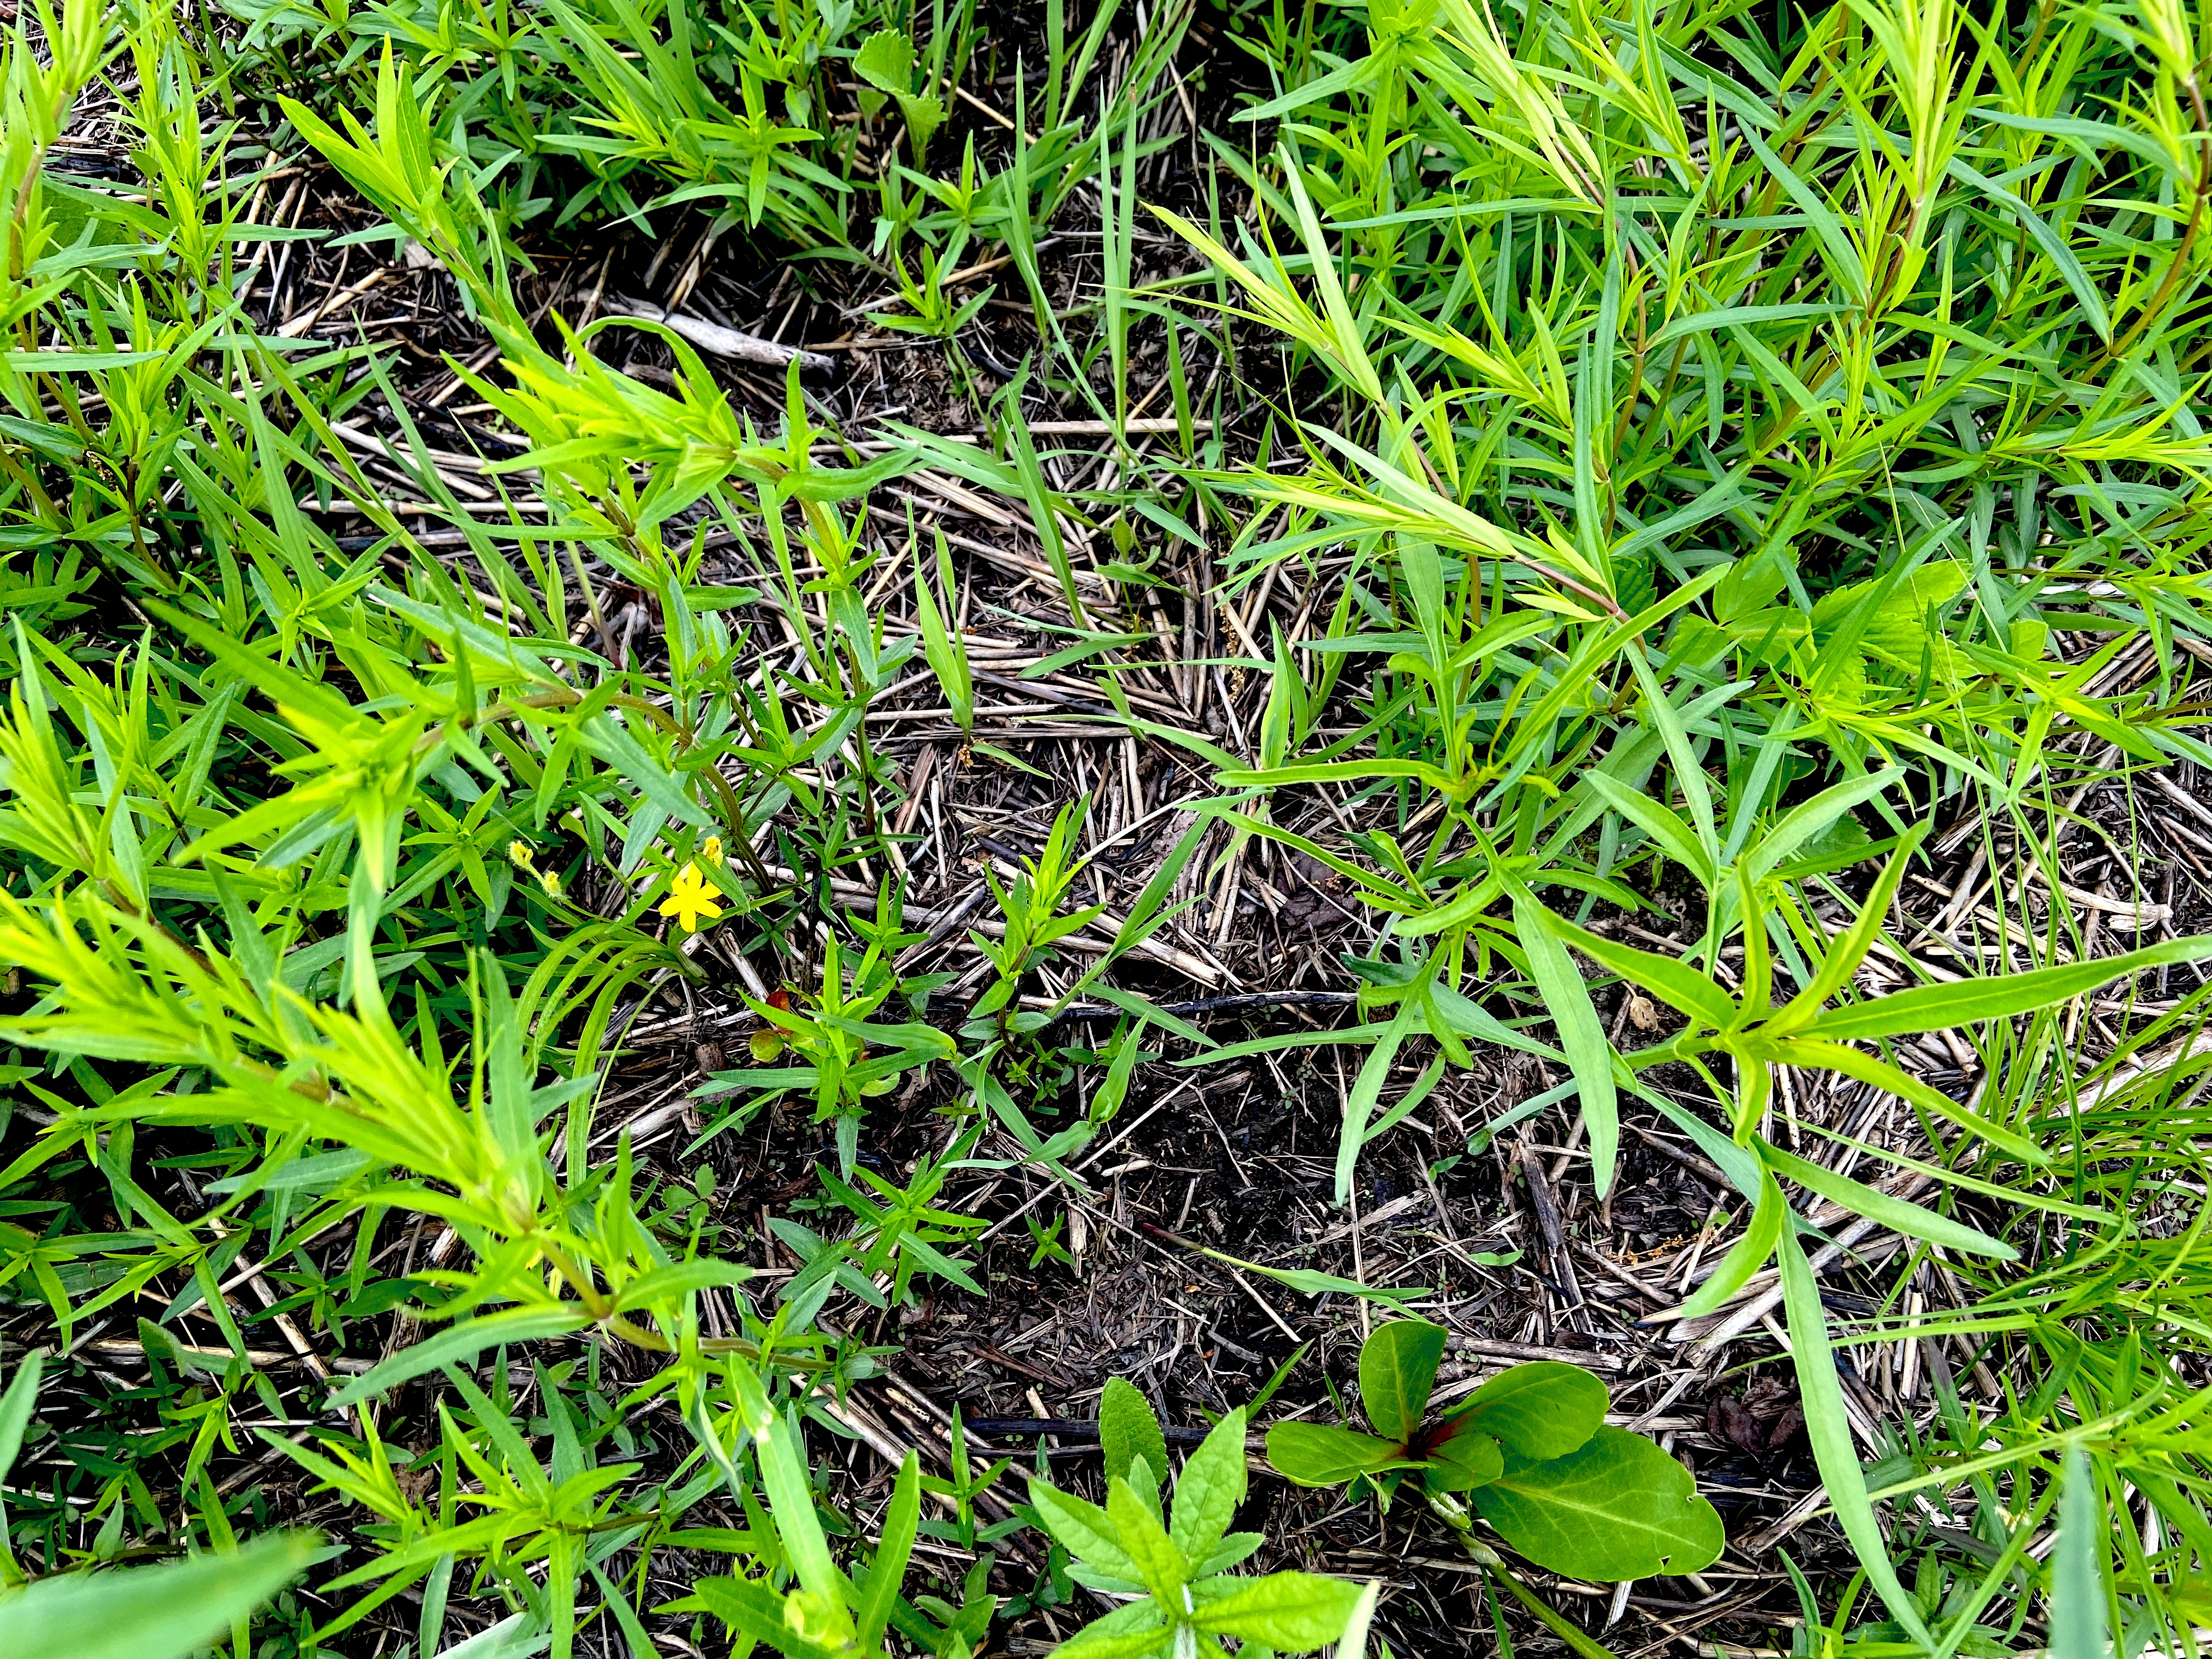
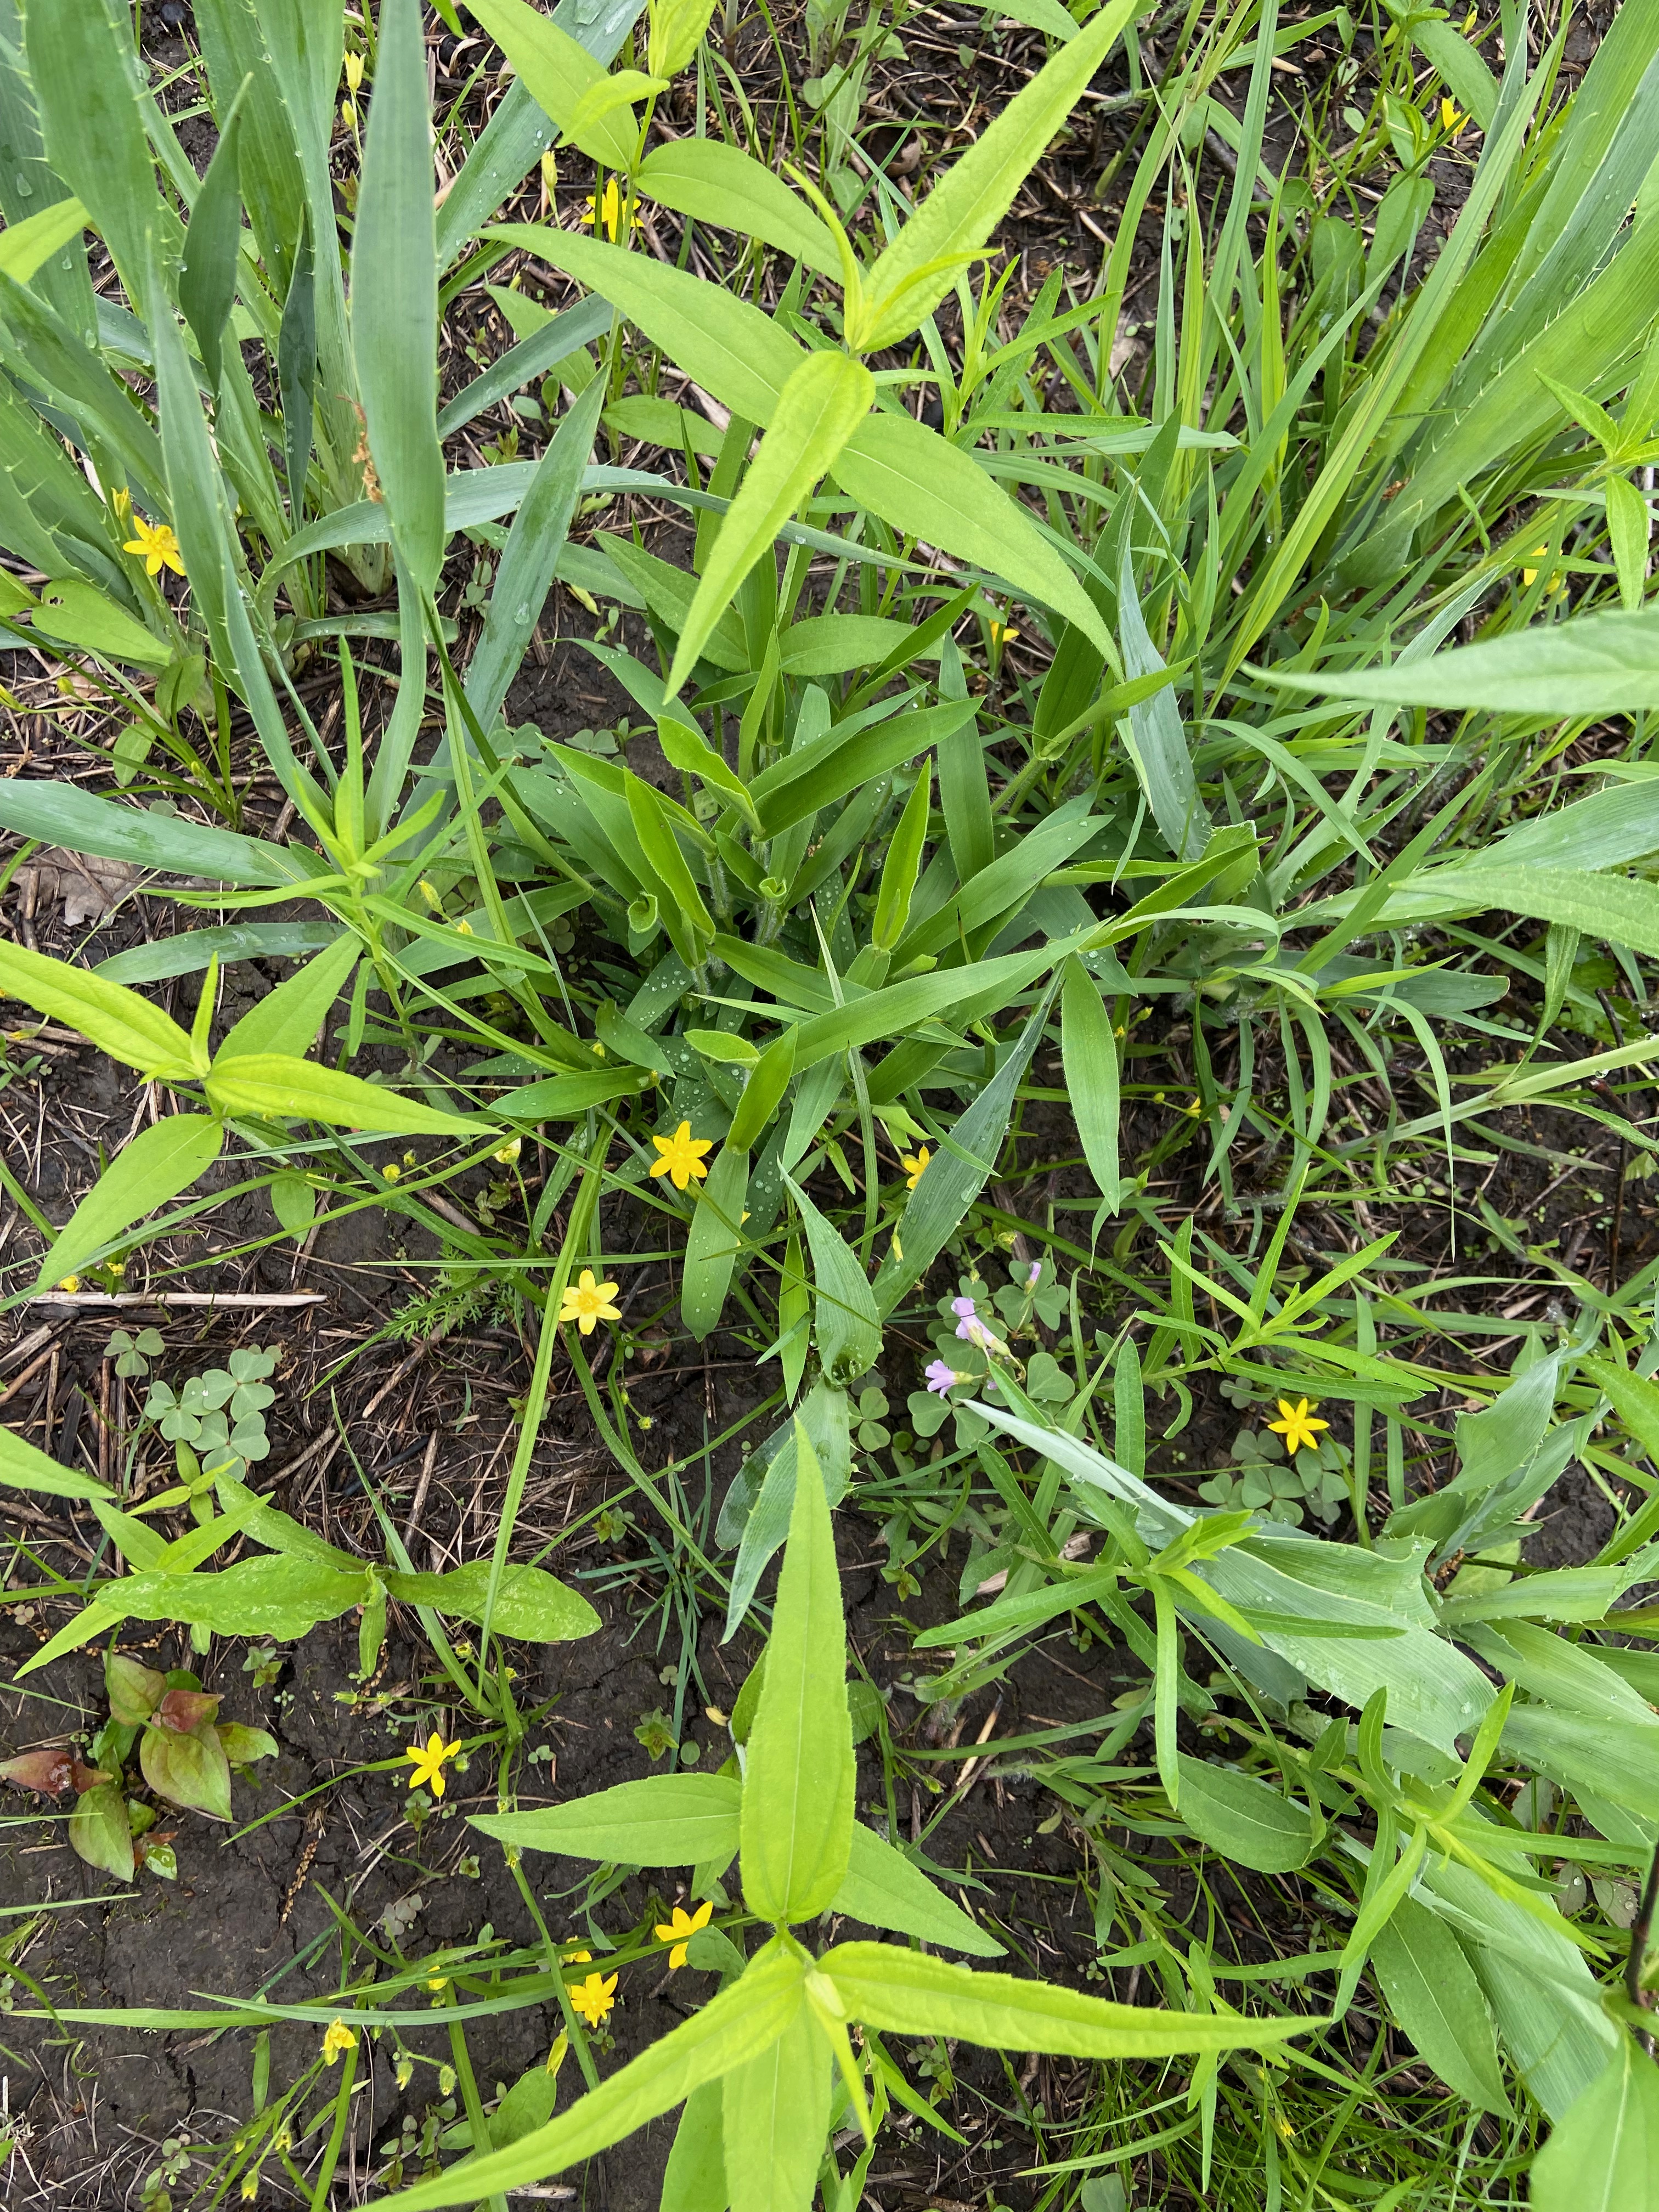
Champaign County: Tomlinson Pioneer Cemetery Prairie Nature Preserve: Seems not to have been burned sufficiently often. Domes of dense hazel have shaded out the previously diverse vegetation over substantial areas.
But it does get burned at least occasionally as shown below in two photos referred to as "recent" on a history website named Clio.


So how concerned should we be?
Three studies help us evaluate. In a 2003 study, Bowles and Jones determined that high-quality prairies and savannas which get burned less often than every two years were declining in quality. Ultimately, insufficient burning means losing species and genetic alleles – defeating the very purpose of these preserves.
Friends of Illinois Nature Preserves have been working with anyone interested to assemble information on the state of the preserves. In the process, Friends field rep Stone Hansard came across a scientific paper on Tomlinson by Ellis and Wolz published by the Illinois State Academy of Science in 2015.
They compared their data to that from nearby prairies, which are thought to be similar to savannas in many respects, and in the absence of high-quality savannas may indeed be the best models. The authors provided these assessments:
● Species richness and diversity at Tomlinson is comparable to prairie and savanna remnants in the Region
● The number of native species recorded at this small preserve (103) is similar to reports from other prairie remnants
● We recorded more native species than Betz and Lamp (1989) in their survey of 29 prairie remnants (range of 30-89 native species per site) and their survey of eight savanna remnants (range of 33-75 native species per site)
● An FQI of 32.7 (36.1 native species only) shows relatively high floristic value. Prairie sites with an I of 35 or higher are considered good quality
● The relatively high species richness in this small preserve is comforting from a conservation perspective
The data in this study make an important contribution. A person could conclude from it that the condition of the site was fine. Given the lack of resources for such studies, the argument could be made that this evaluation was sufficient.
But as it turned out, a third paper, this one by Bowles and McBride, included data on this same preserve seventeen years earlier. This paper was a report to the Illinois Department of Natural Resources. Ellis and Wolz seem not to have known about this “before” data and didn’t use it to assess trends.
Data Sets Compared
Both Tomlinson studies based their analysis on quadrat data. In 1996, Bowles and McBride highlighted eight species as especially significant; they comprised 50% of total relative cover (basically, how much total leaf surface is attributable to the various species). These eight species “dominated” the plant community in 1996.
One way to compare is “floristic quality assessment.” Key to this approach are the various species’ Coefficients of Conservatism (C). Higher numbers suggest a community of greater quality, integrity, or health. In the table below we compare the species that comprised 50% of cumulative relative frequency in Bowles and McBride with the comparable eight species in Ellis and Wolz.
The mean C for the eight most common species in the two studies were as follows:
| 1996 | 2013 | % decrease |
Mean C | 4.5 | 3.1 | 31% |
With good management of a natural area, we would expect the Mean C of the dominant vegetation to remain stable or increase. A drop of 31% in less than two decades suggests a major loss in quality. Therefore this result is troubling.
The meaning of the above disappointing numbers becomes clearer when we compare the two dominant plant lists. In 1996 the eight species that comprised half the relative cover (roughly equivalent to “most common”) are shown in Table 1a.
All the species in Table 1 (except the “weedy” wild lettuce) are characteristic of high-quality savannas. Under normal conditions they, or others like them, could be expected to remain the most common in this preserve.
Table 1. Most common plants in 1996
Scientific Name | C | Common Name |
Andropogon gerardii | 5 | big bluestem |
Calystegia spithamaea | 10 | dwarf bindweed |
Corylus americana | 4 | American filbert |
Elymus canadensis | 4 | Canada wild rye |
Euphorbia corollata | 3 | flowering spurge |
Helianthus hirsutus | 5 | bristly sunflower |
Lactuca canadensis | 1 | wild lettuce |
Sorghastrum nutans | 4 | Indian grass |
Table 1b shows the comparable species list in 2013.
 |
A first warning sign in this data is that three of the most common species in 2013 suggest degradation: Kentucky blue grass, black raspberry, and Canada goldenrod. Indeed, Kentucky bluegrass, a species said to be associated with insufficient burning, was the second most frequent species recorded in 2013 (in 90% of the plots).
It’s worth it for conservationists to learn to understand such measures and indicators. We who care need to be well-informed, to set our own priorities. Where should we volunteer to help? What should we advocate for? Where should we contribute funds? How do we compellingly make our voices heard?
Government programs don’t work if left to the politicians and staff alone. More “citizen scientists” and dedicated volunteer advocates are needed. As the preserve system has grown, the budget and staffing have shrunk, possibly because most people who care don’t know that there’s a problem. Are many Nature Preserves facing declines like those faced by Tomlinson? Is there a practical way to evaluate all the Nature Preserves? How confident are we that we’re not letting their quality slip away?
In the early days of the Nature Preserve System, people thought that we could mostly just erect fences and let nature “take its course.” Sadly, in recent decades, a variety of stresses have overwhelmed the capacities of natural areas to manage themselves. The elimination of predators. reduced fire frequency, introduction of exotic species, climate change, fragmentation, and urban sprawl took their toll.
The 639 Illinois Nature Preserves total 125,284 acres. The value of this land, based on averaging various sources is $6.3 billion dollars. We, the public, paid for that land, through donations, tax breaks, and in other ways. That’s a wise investment in precious, rare, and irreplaceable biodiversity. Quality preserves also provide many other public benefits. And yet, large parts of this nature are still uncared for or under-cared-for. Many seem to be degrading as a result of a lack of needed resources.
The Nature Preserves System needs a better approach to studies and monitoring. For example, if an academic or citizen scientist is attempting to conduct a helpful study, there should be someone who could click a button and get access to a list of other studies on the site.
Three Photos
Two photos from Matt Evans may help readers to visualize this preserve. They are from 2019.
 |
| The orange leaves are the shrub hazel. |
 |
| Hazelnut bushes and young oak trees are a natural part of a savanna. But diverse and conservative herb vegetation is critical to a savanna preserve's biodiversity. If the woody vegetation becomes so dense that it shades out and kills off much of the herb diversity, a large part of the value of the preserve is lost. |
Backstory
What’s important about Nature Preserves is that they are the last surviving habitats for hundreds of species of now-rare and interdependent plants and animals.
For any species of plant to be adequately conserved, it needs a full complement of its genetic diversity. That typically requires a population of 50 or 100 individuals, or more. Next, each plant species has other species associated with it (and often interdependent with it).These associated species include animals, fungi, other soil biota, and more. It has been estimated that for every plant there are an estimated 10 associated animal species. The easiest to monitor are the plants.
If numbers of plants and animals (mostly invertebrates, including pollinators and predators that help keep the system in balance) fall below what it takes to survive disease outbreaks, droughts, fire, etc., the system may gradually lose sustainability. Then the many diverse species are replaced by a few common ones. As species and genetic richness are lost, overall survivability of the ecosystem declines. For more details on biodiversity, click here.
Monitoring by simple species counts is insufficient. One plant of a species surviving makes the list look good, but most genetic diversity of that species has likely been lost, and any species of interdependent pollinators or other animals are likely gone as well.
Miscellaneous Notes:
Bowles and McBride sampled only once. As Ellis and Wolz sampled throughout the growing season (six times), they were able to list an additional 54 species, indicating more complete sampling. But the mean C of these 54 was a disappointing 2.8.
An impressive 2013 growing-season-long video of Tomlinson can be found here.
References:
Bowles, M. and J. McBride. 1996. Report to the Illinois Department of Natural Resources, The Morton Arboretum, Lisle, Ill. Click here.
Bowles, Marlin and Michael Jones. 2003. Twenty-five Year Trends of Chjange in Prairie and Wetland Natural Areas in the Chicago Region of Northeastern Illinois. Illinois Department of Natural Resources. Click here.
Ellis, James L. and Kevin J. Wolz. Vegetation of Tomlinson Pioneer Cemetery Prairie Nature Preserve, Champaign County, Illinois. Transactions of the Illinois State Academy of Science (2018) Volume 111, pp. 11-16 received 12/1/15 accepted 3/4/18. click here.
Universal FQI. The FQI Database used in this post was: Taft, J. B., Wilhelm, G. S., Ladd, D. M., & Masters, L. A. 1997. Floristic quality assessment for vegetation in Illinois, a method for assessing vegetation integrity. Westville: Illinois Native Plant Society. Click here.
For other posts on monitoring and studies, click here.
Acknowledgements
The authors of the scientific papers deserve principal credit. There would be no solid basis for evaluating this preserve without their important work. Credit goes to Marlin Bowles, Jenny McBride, James Ellis, and Kevin Wolz. There should be more funding for such work.
Burns and management of Tomlinson are to the credit of the Champaign County Forest Preserve District.
Thanks to Clio (https://theclio.com) for the burn photos.
Thanks to Matt Evans for the growing season photos.